Don’t take our word for it. Use the systems.
Start with a sample service company running a full day on one screen. Then price your own revenue leak and read the exact report a paying client receives. No email gate on any of it.
One screen for the whole service day. Without calling a single tech.
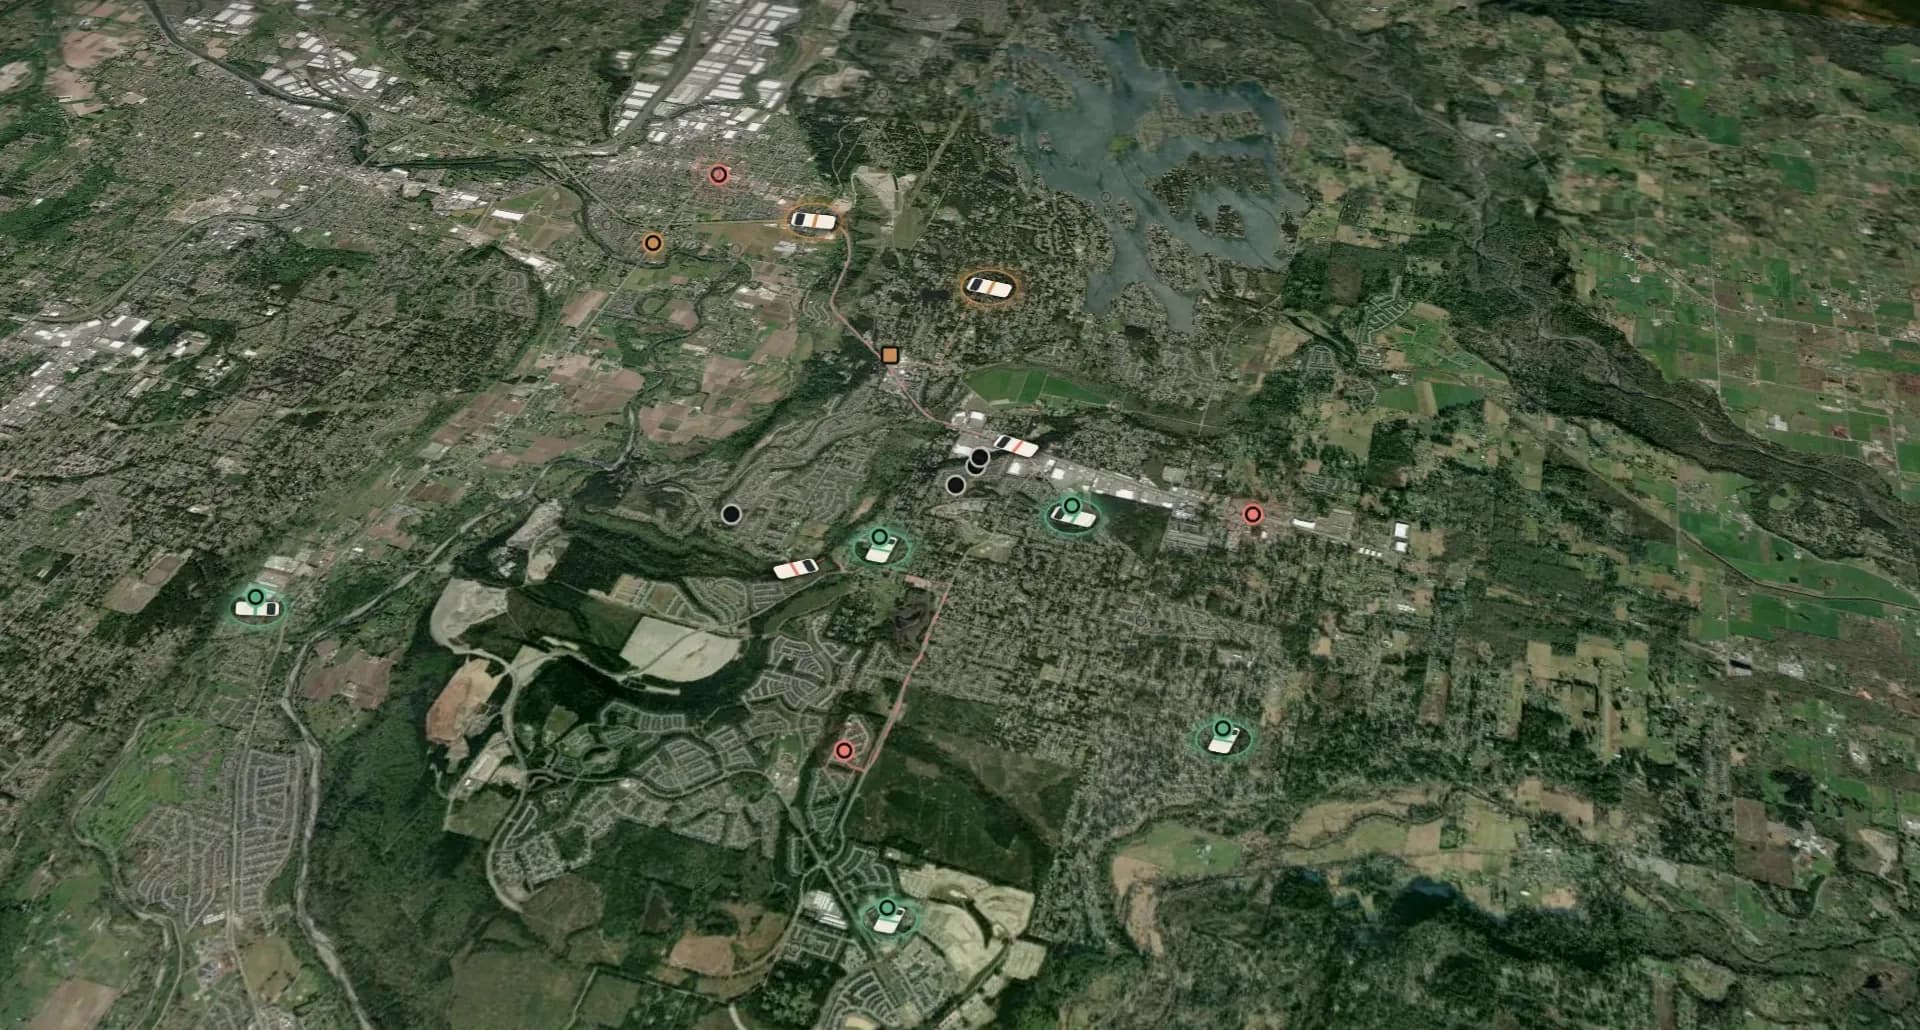
Ridgeline Mechanical is a made-up HVAC and plumbing company working the real roads of Sumner and Bonney Lake, Washington. Overnight the AI answered four calls and booked three. At 7 AM a dispatcher approved the routes. Press play and watch nine trucks work the day.
- Techs on the road
- 9
- Jobs in one day
- 53
- Calls the AI answered overnight
- 4
Fictional company, names, and revenue. Real streets, with drive times estimated from the road network. Imagery: Esri, Maxar, Earthstar Geographics. Roads: © OpenStreetMap contributors (opens in a new tab).
Open full screen (opens in a new tab)- Trucks route on the actual street network, with drive times estimated from the roads between jobs.
- The AI answers after-hours calls and books the ones that fit the schedule. A person approves every dispatch.
- Type a question the way an owner would, like who is closest to Lake Tapps or what came in last night.
Want this view for your own trucks? Start with a 30-minute call.
Price your own leak.
Your numbers, simple math. No benchmarks, no guesses but yours.
Out of 10 inbound leads, how many get a response within 5 minutes?
Out of 10 follow-ups your pipeline needs, how many actually happen?
$48,712/month
riding on response speed and follow-up combined
baseline = 20 leads/wk × 4.33 wks × 30% close × $2,500 = $64,950/mo
response.speed = 20 × 4.33 × 5/10 slow × 30% × $2,500 = $32,475/mo
follow.up = $64,950 baseline × 5/10 missed = $32,475/mo
total = $64,950 × (1 − 5/10 fast × 5/10 followed up) = $48,712/mo
Every number above is yours. We just did the multiplication.
The report maps exactly where these leaks live in your operation and what we would deploy to close them.
Read the exact report you’d receive
This is a complete sample Friction Report, built from a fictional home-services operation and labeled as a sample on every page, so you can judge the deliverable before paying for one. Same template, same methodology, same rigor a paying client receives.
Yours is built from your operation, your numbers, your operators’ own words. Delivered within 72 hours of the interview.